Both systematic strategies — Simply Balanced and Simply Leveraged — were tested against the same 10‑year window on QuantConnect. Same engine. Same fills. Same starting equity. Compared side‑by‑side with SPY and QQQ buy‑and‑hold.
Same 10‑year backtest window, same engine, same fills, same starting equity. The "Winner" column flags which strategy led on each metric — risk, return, and consistency are not always won by the same name.
| Metric | SPY · Buy & Hold | QQQ · Buy & Hold | Simply Balanced | Simply Leveraged | Winner |
|---|---|---|---|---|---|
| Starting Equity | $25,000 | $25,000 | $25,000 | $25,000 | — |
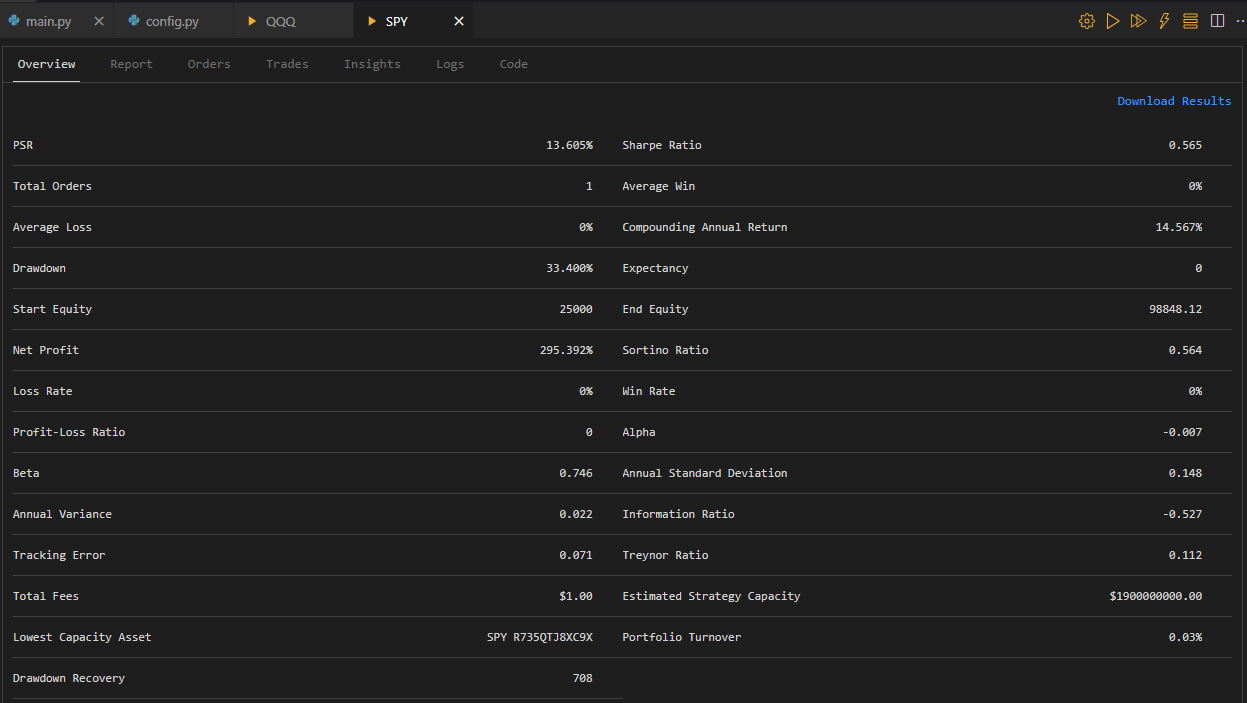
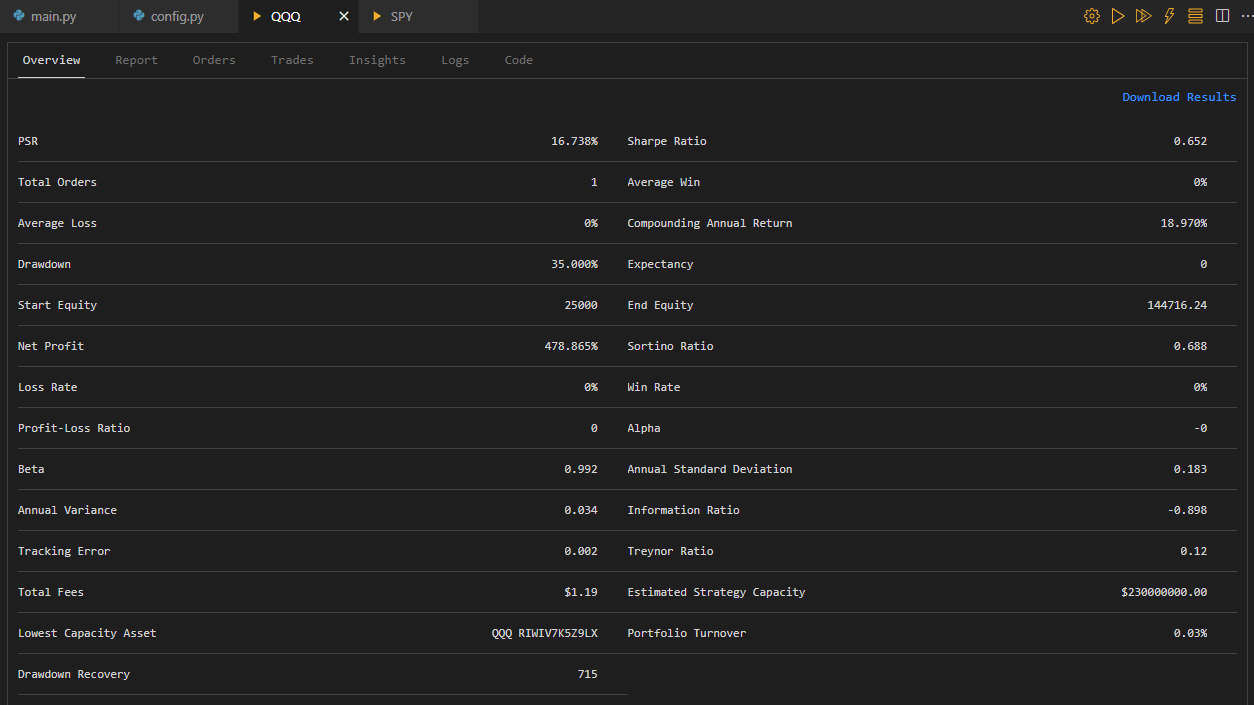
| Ending Equity | $98,848 | $144,716 | $293,850 | $596,745 | Simply Leveraged |
| Net Profit | 295.4% | 478.9% | 1,075.4% | 2,287.0% | Simply Leveraged |
| Compounding Annual Return | 14.57% | 18.97% | 27.61% | 36.87% | Simply Leveraged |
| Max Drawdown | 33.40% | 35.00% | 21.90% | 41.00% | Simply Balanced |
| Drawdown Recovery (days) | 708 | 715 | 373 | 437 | Simply Balanced |
| Sharpe Ratio | 0.57 | 0.65 | 1.01 | 0.87 | Simply Balanced |
| Sortino Ratio | 0.56 | 0.69 | 0.99 | 0.86 | Simply Balanced |
| Probabilistic Sharpe (PSR) | 13.6% | 16.7% | 59.4% | 25.5% | Simply Balanced |
| Win Rate | n/a | n/a | 73% | 67% | Simply Balanced |
| Profit‑Loss Ratio | n/a | n/a | 2.08 | 1.65 | Simply Balanced |
| Alpha | −0.01 | 0.00 | 0.11 | 0.17 | Simply Leveraged |
| Beta | 0.75 | 0.99 | 0.55 | 0.93 | — |
Mixed leveraged + non‑leveraged ETFs. Total leverage held under 2x. Built to win on consistency, recovery speed, and risk‑adjusted return.
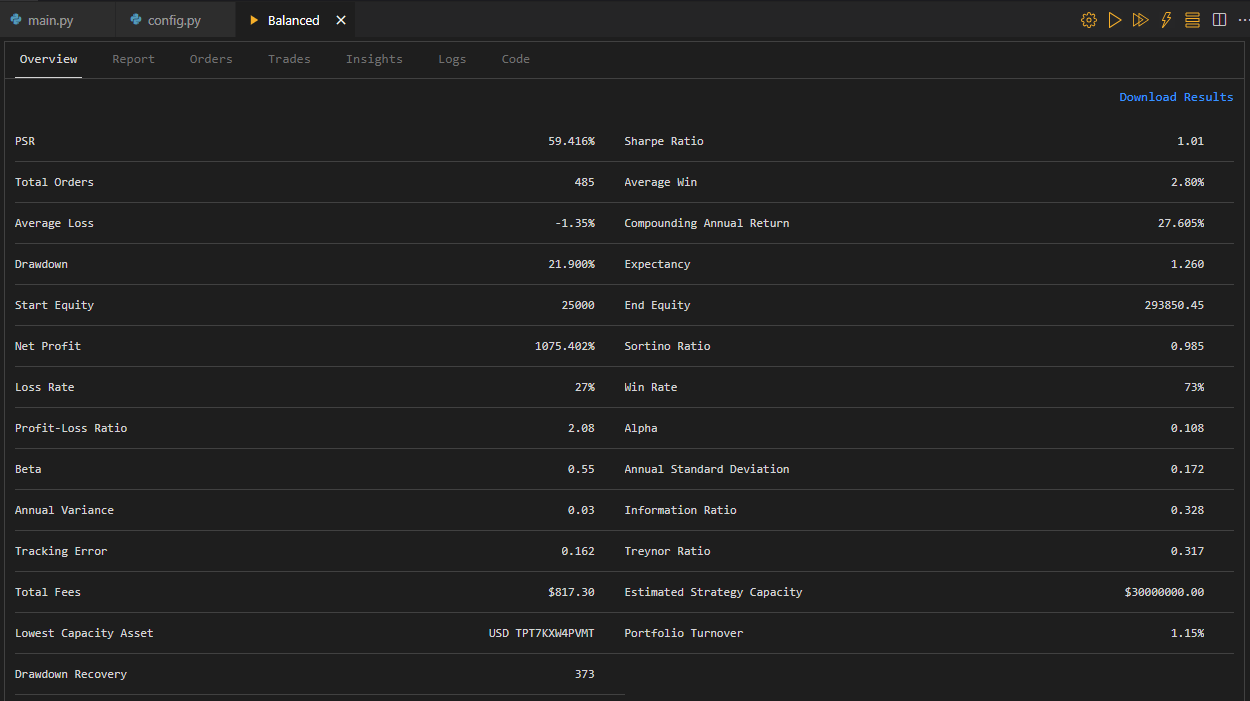
Nearly 3 in 4 trades close profitable. Profit‑Loss Ratio of 2.08 — winners are 2× larger than losers on average.
Worst drawdown was recovered in roughly half the time SPY and QQQ took. Compounding stays on schedule.
Probabilistic Sharpe — the likelihood the live Sharpe exceeds 0.5. Highest of all four strategies tested.
100% leveraged ETFs. Total leverage held under 3x. Built for compounding when momentum is strong — paired with systematic exits to cash during turbulence.
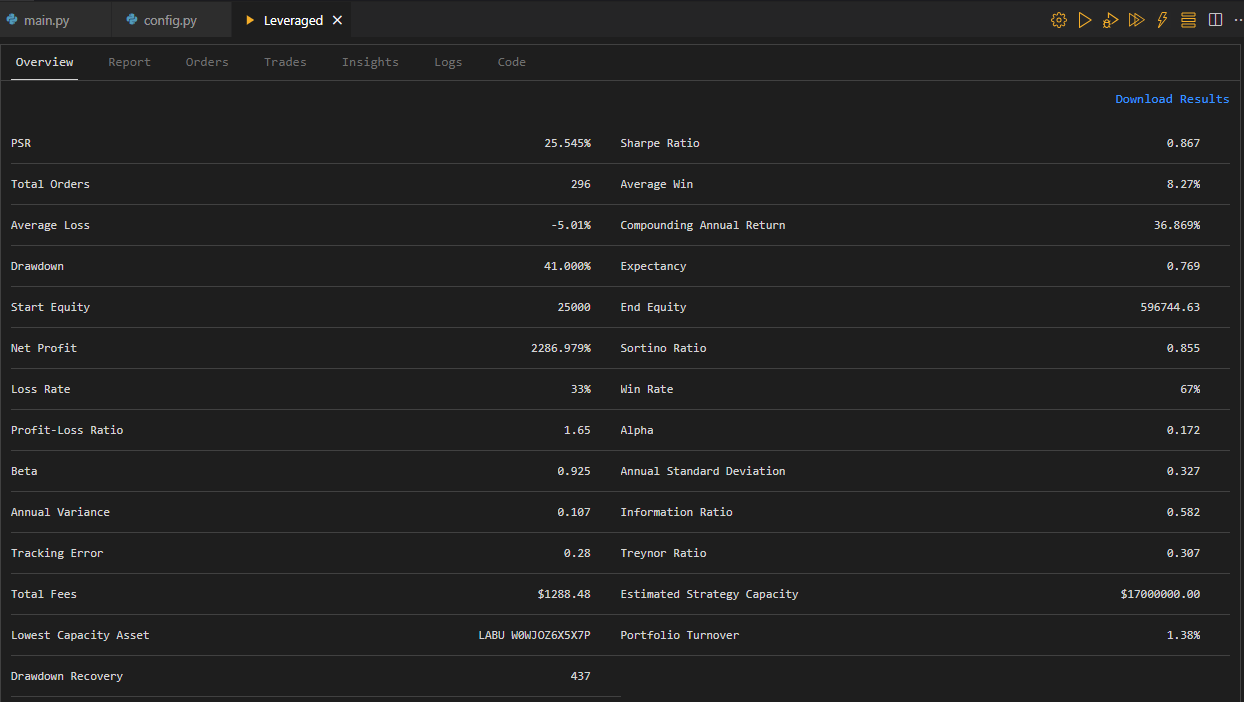
$25,000 grew to ~$596,000 over 10 years in the backtest — roughly 4× what QQQ buy‑and‑hold returned in the same window.
The trade‑off: largest peak‑to‑trough drop of any strategy here. Only run this with capital you're committed to a multi‑year horizon.
Highest excess return vs benchmark of all four — the systematic momentum + exit rules generated returns the market itself didn't.
For an apples‑to‑apples comparison, here are the same two passive benchmarks run through QuantConnect over the identical 10‑year window with the same starting equity.
No cherry‑picked dates. No survivorship bias. No selective metric reporting. Same engine and assumptions across all four strategies.
All four strategies tested over the same January 2016 – December 2025 window — through the 2018 correction, COVID crash, 2022 bear market, and the rallies between.
$25,000 in every test. Apples‑to‑apples ending equity, profit, and drawdown comparisons.
Institutional‑grade backtest platform with realistic fills, slippage, and commissions. Same broker model used for benchmarks and strategies.
All numbers shown above are taken directly from the QuantConnect overview pages. Screenshots are unmodified.
Backtested results are simulated. They reflect how the strategy would have performed historically using current rules — not actual live trading. Past performance does not guarantee future results, and live results will differ from backtests due to slippage, fills, real‑world events, and rule refinements. Leveraged ETFs carry compounding risks including decay in sideways markets. Only invest capital you can commit to a multi‑year horizon and afford to see drawn down significantly. Consult a qualified financial advisor before subscribing.
Backtests show the design. The Collective2 listings show the live fills, in real time, going forward.